Best Monitoring Tools for SysAdmins 2026
[DISCLOSURE] This post contains affiliate links. If you purchase through my links, I may earn a commission at no extra cost to you. I only recommend tools I’ve researched or used personally.
It’s 2am. Your phone lights up. A critical service just went down and nobody caught it — because nobody was watching. By the time someone notices in the morning, you’ve got angry stakeholders, lost revenue, and a long incident report to write.
That’s exactly what the right monitoring tool prevents.
After 10+ years managing Linux infrastructure, I’ve used everything from hand-rolled Nagios configs to modern cloud-native observability stacks. This guide cuts through the noise and shows you exactly what’s worth your time in 2026.
Whether you’re a solo SysAdmin managing a handful of servers or running a team watching hundreds of nodes — there’s a tool on this list for you.
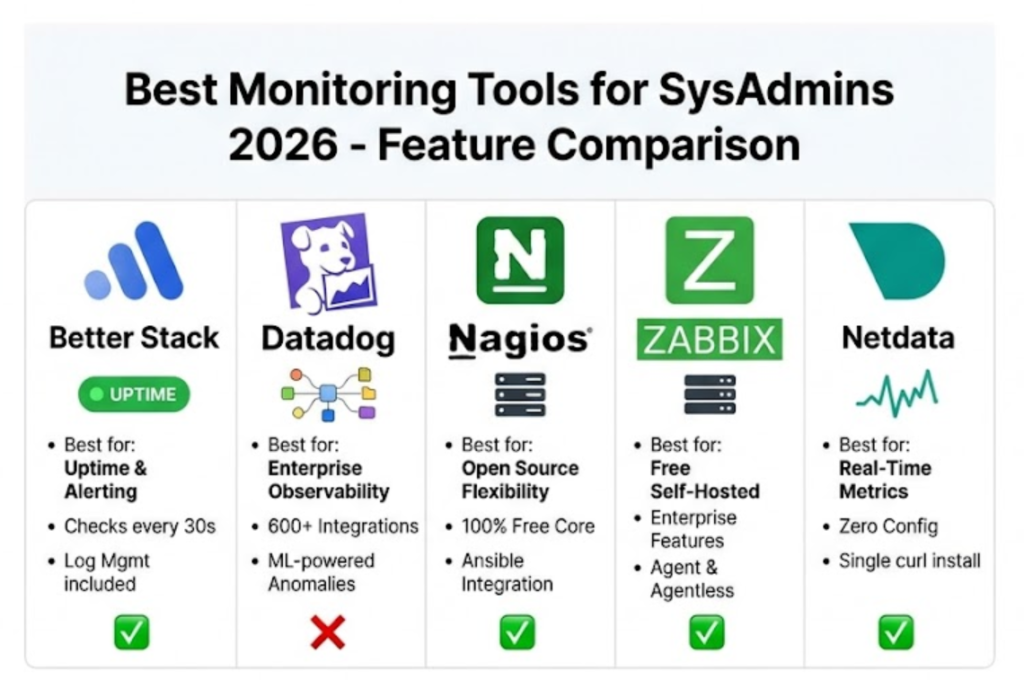
Quick Comparison Table
| Tool | Best For | Free Plan | Starting Price |
|---|---|---|---|
| Better Stack | Uptime + alerting | ✅ | $20/mo |
| Datadog | Enterprise observability | ❌ | $15/host/mo |
| Nagios | Open source flexibility | ✅ | Free |
| Zabbix | Self-hosted monitoring | ✅ | Free |
| Netdata | Real-time metrics | ✅ | Free |
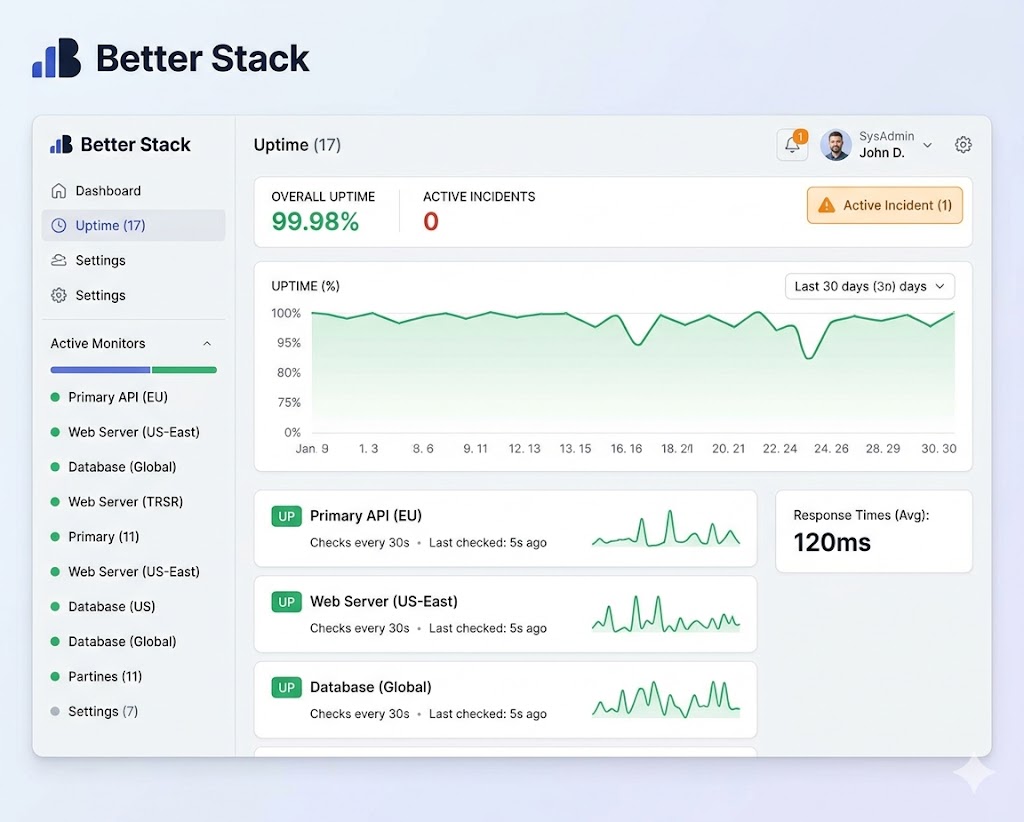
1. Better Stack — Best for Uptime Monitoring and Alerting
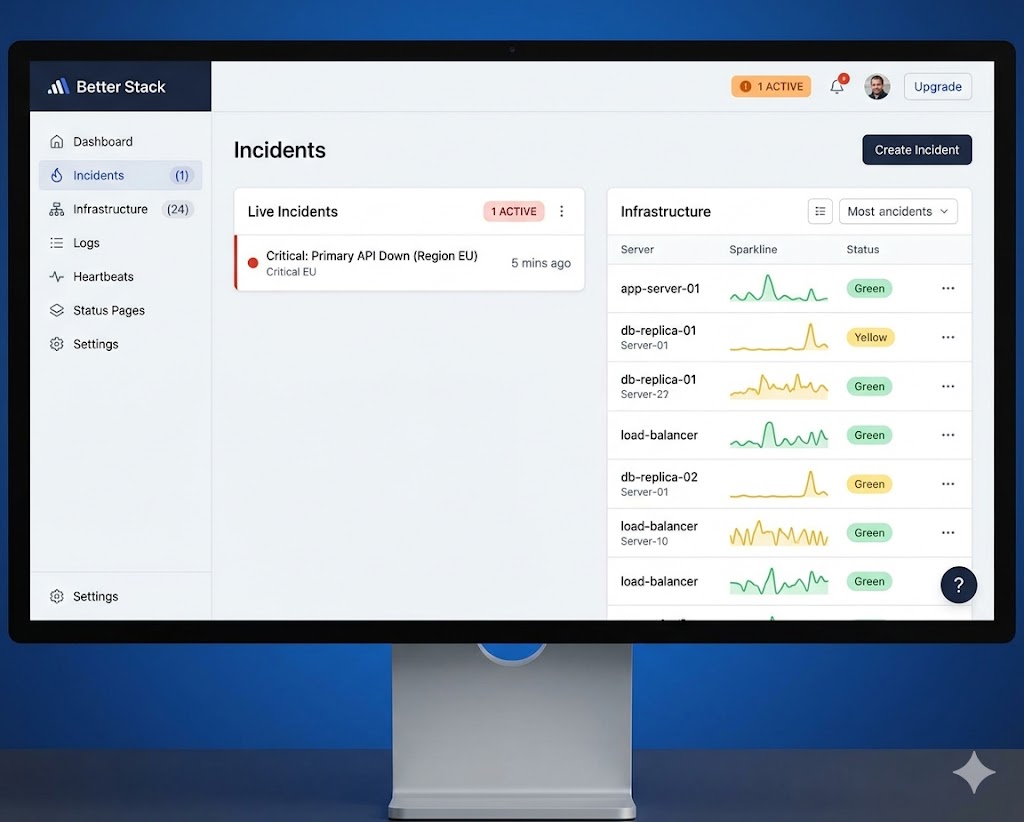
If you only add one monitoring tool to your stack this year, make it Better Stack. What used to require three separate tools — uptime monitoring, incident management, and status pages — Better Stack bundles into one clean platform that actually makes sense to use.
I’ve seen SysAdmins spend weeks configuring Nagios to do what Better Stack does out of the box in about 20 minutes.
Why SysAdmins Love It
- Uptime checks every 30 seconds from multiple global locations
- Instant alerts via SMS, email, Slack, PagerDuty, or phone call
- Beautiful public status pages — perfect for client-facing environments
- Built-in on-call scheduling and escalation policies
- Log management and query tools included
- Clean REST API for automation and integration
Pricing
| Plan | Price | Monitors |
|---|---|---|
| Free | $0/mo | 10 monitors |
| Starter | $20/mo | 50 monitors |
| Business | $60/mo | Unlimited |
Verdict
Better Stack is the monitoring tool I recommend first to every SysAdmin. It’s fast to set up, reliable, and the free plan is genuinely useful for smaller environments. Pair it with your cloud VPS and you’ve got eyes on everything within minutes.
2. Datadog — Best for Enterprise Observability
[IMAGE MARKER: Datadog dashboard screenshot or logo]
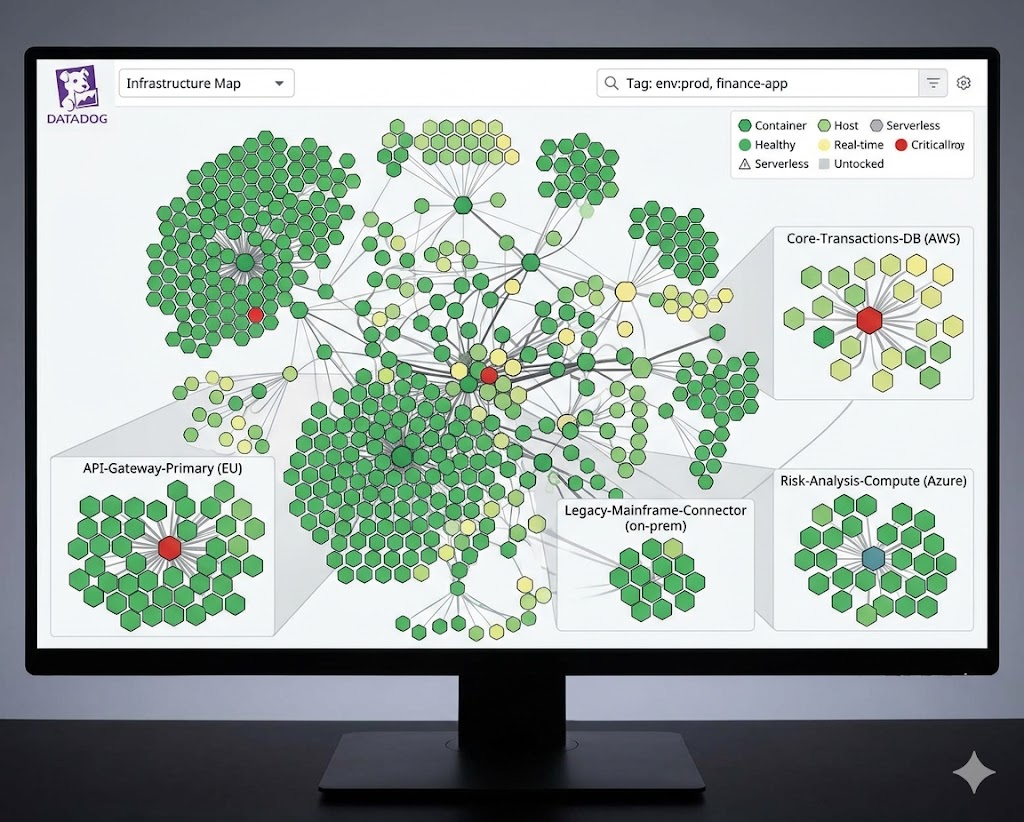
Datadog is the 800-pound gorilla of infrastructure monitoring. If you’re working in a mid-to-large enterprise environment with complex distributed systems, Datadog gives you visibility that nothing else matches.
It’s not cheap. But when you’re managing hundreds of hosts, microservices, and cloud resources across multiple platforms — the unified observability Datadog provides pays for itself fast.
Why SysAdmins Love It
- Full-stack observability — infrastructure, APM, logs, and security in one place
- 600+ integrations including AWS, Azure, GCP, Kubernetes, and Docker
- Machine learning-powered anomaly detection and forecasting
- Live container and process monitoring
- Custom dashboards with drag-and-drop simplicity
- RBAC and audit logs for compliance-heavy environments
Pricing
| Plan | Price |
|---|---|
| Infrastructure | $15/host/mo |
| APM | $31/host/mo |
| Log Management | From $0.10/GB |
Verdict
Datadog is overkill for a 5-server homelab. But if you’re managing production infrastructure at scale — especially in a financial services or enterprise environment — it’s the industry standard for good reason.
3. Nagios — Best Open Source Monitoring

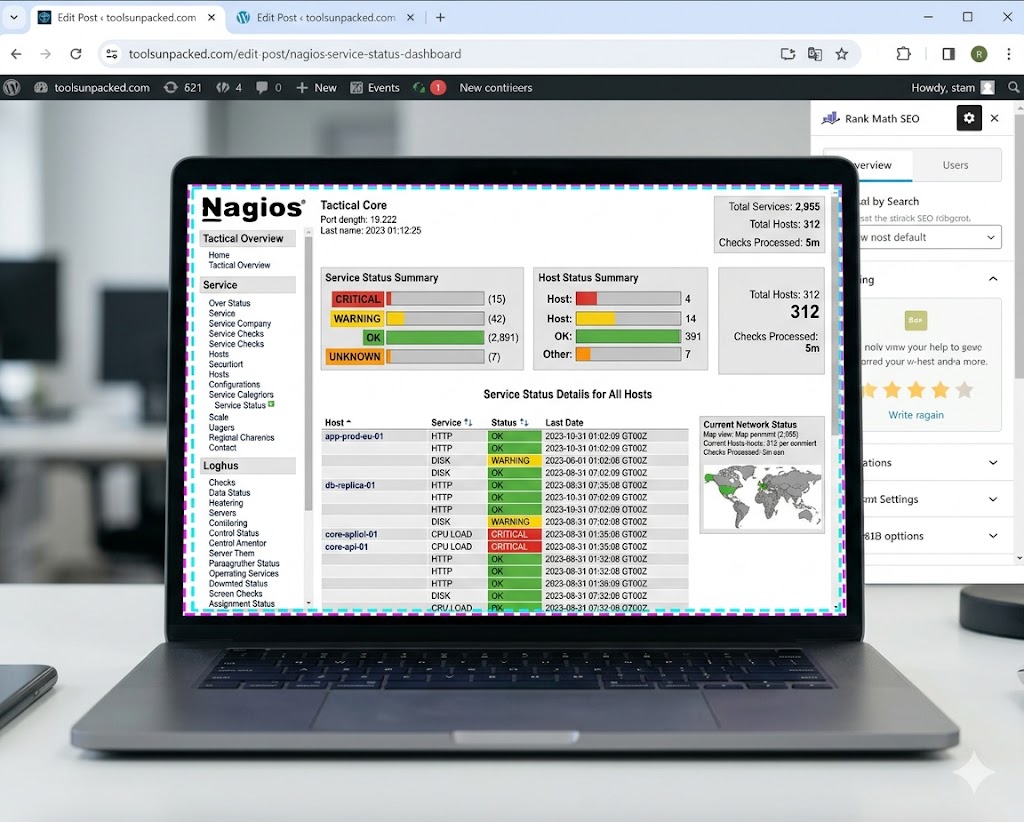
Nagios has been around since 1999 and it’s still running strong in server rooms around the world. It’s not pretty. The UI feels like it was designed in a different era — because it was. But the flexibility and community support are unmatched in the open source world.
If you know your way around a Linux config file, Nagios gives you monitoring that you fully own and control with zero licensing costs.
Why SysAdmins Love It
- 100% open source — no vendor lock-in
- Monitor virtually anything with custom plugins
- Massive plugin library with 50+ years of community contributions
- Active alerting via email, SMS, and custom scripts
- Runs on any Linux server you already own
- Deep integration with Ansible for automated config management
Pricing
| Version | Price |
|---|---|
| Nagios Core | Free |
| Nagios XI | From $1,995 one-time |
Verdict
Nagios Core is free forever and battle-tested across millions of environments. The learning curve is real — but if you’re already comfortable in Linux, you’ll get it running fast. Pair it with the Bash Script Library to automate your Nagios checks and save hours of manual configuration.
4. Zabbix — Best Free Self-Hosted Monitoring

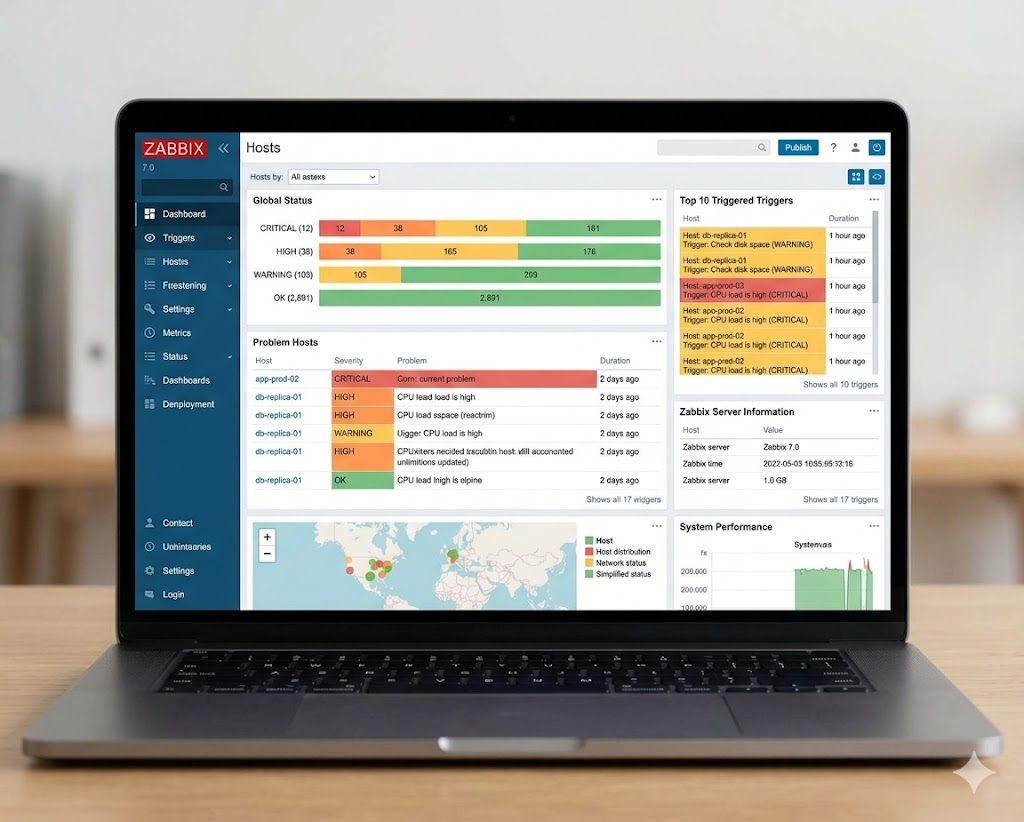
Zabbix is what you reach for when you want enterprise-grade monitoring without the enterprise price tag. It’s fully open source, self-hosted, and packed with features that would cost hundreds per month on a SaaS platform.
The UI has come a long way in recent years. Zabbix 7.0 feels modern and approachable compared to older versions — and performance at scale has improved dramatically.
Why SysAdmins Love It
- Monitor servers, network devices, VMs, containers, and cloud resources
- Auto-discovery of new hosts and services
- Built-in templates for Linux, Windows, Cisco, VMware, and more
- Powerful trigger system for custom alerting logic
- Native integration with PagerDuty, Slack, and MS Teams
- Active and passive agent modes for flexible deployment
Pricing
| Version | Price |
|---|---|
| Zabbix Open Source | Free forever |
| Zabbix Enterprise | Custom pricing |
Verdict
Zabbix is the tool I’d deploy in any environment where budget is tight but monitoring requirements are serious. It takes a weekend to set up properly — but once it’s running, it handles thousands of metrics without breaking a sweat. Use the Ansible Playbook Starter Pack to automate your Zabbix deployment and skip the manual setup headaches.
5. Netdata — Best for Real-Time Metrics

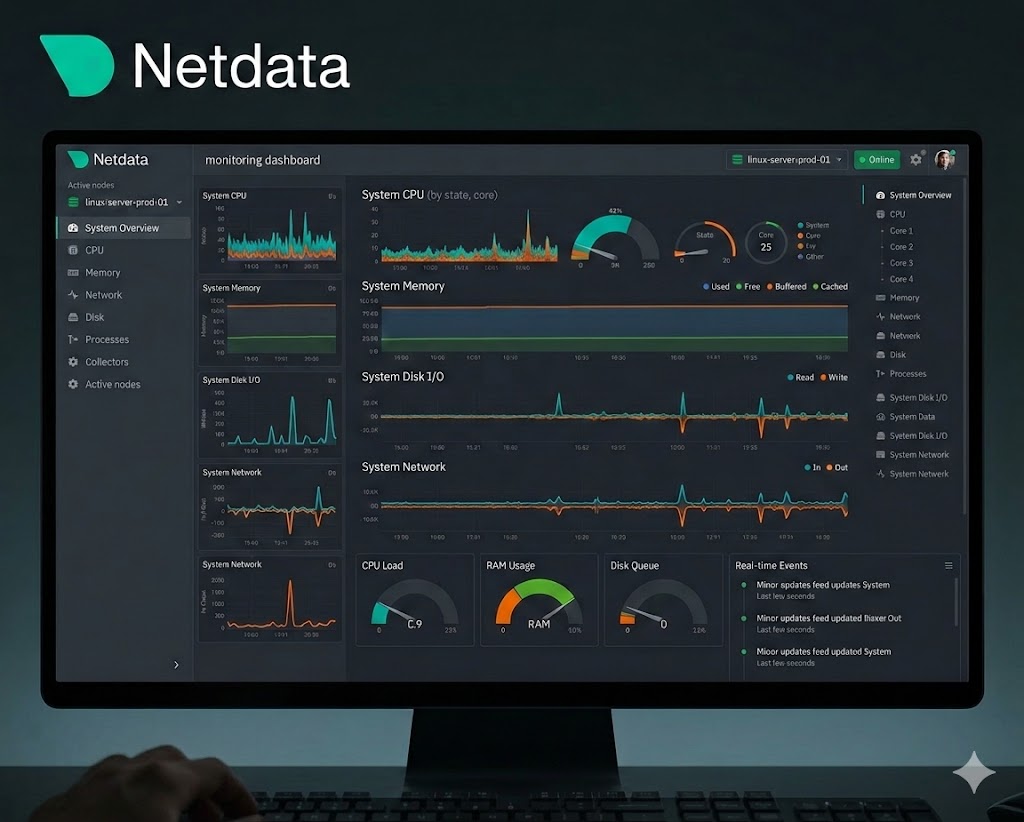
Netdata is the tool you install when you need to know what’s happening on a server right now. No complex setup. No waiting for data to aggregate. Just raw, real-time metrics streaming directly in your browser within two minutes of installation.
It’s not a replacement for a full observability stack — but as a lightweight, always-on performance monitor, nothing comes close.
Why SysAdmins Love It
- Install with a single curl command
- Real-time per-second metrics — CPU, memory, disk, network, processes
- Zero configuration required for basic monitoring
- 800+ pre-built integrations and collectors
- Netdata Cloud available for multi-node visibility
- Extremely low system resource usage
Pricing
| Plan | Price |
|---|---|
| Open Source | Free forever |
| Netdata Cloud Free | $0 — up to 5 nodes |
| Netdata Cloud Pro | $30/mo |
Verdict
Netdata is the first thing I install on any new Linux server. It costs nothing, takes two minutes, and immediately tells you everything you need to know about system performance. It’s not your primary monitoring platform — but it’s an essential tool in every SysAdmin’s kit.
How to Choose the Right Monitoring Tool
Not every environment needs the same solution. Here’s a simple framework:
Choose Better Stack if:
- You need uptime monitoring and client-facing status pages
- You want fast setup with zero infrastructure overhead
- You’re a solo SysAdmin or small team
Choose Datadog if:
- You’re in an enterprise environment with complex infrastructure
- You need full-stack observability across cloud, containers, and APM
- Budget is not the primary concern
Choose Nagios if:
- You want full control and zero licensing costs
- You’re comfortable with Linux config files
- You need deep customization through plugins
Choose Zabbix if:
- You need enterprise features without enterprise pricing
- You’re managing a large number of hosts on-premises
- You want self-hosted with no data leaving your network
Choose Netdata if:
- You need instant real-time visibility on any Linux server
- You want zero-config monitoring up in minutes
- You’re using it alongside another primary monitoring tool
Frequently Asked Questions
Q: What is the best monitoring tool for Linux SysAdmins in 2026? For most SysAdmins, Better Stack is the best starting point — fast setup, solid free plan, and excellent alerting. For larger environments, Datadog or Zabbix are the go-to choices depending on your budget.
Q: Is Nagios still worth using in 2026? Yes — especially Nagios Core. It’s free, battle-tested, and incredibly flexible. The UI is dated but the monitoring engine is rock solid. It’s still running in production environments worldwide.
Q: What’s the difference between Zabbix and Nagios? Both are open source, but Zabbix is more modern, easier to set up, and better suited for large-scale environments out of the box. Nagios wins on plugin flexibility and community longevity.
Q: Can I use multiple monitoring tools together? Absolutely — and most SysAdmins do. A common stack is Netdata for real-time server metrics, Better Stack for uptime and alerting, and Zabbix or Datadog for deeper infrastructure visibility.
Q: How do I automate monitoring setup with Ansible? All five tools on this list can be deployed and configured with Ansible. Check out the Ansible Playbook Starter Pack for ready-to-run playbooks that handle Nagios, Zabbix, and Netdata deployments automatically.
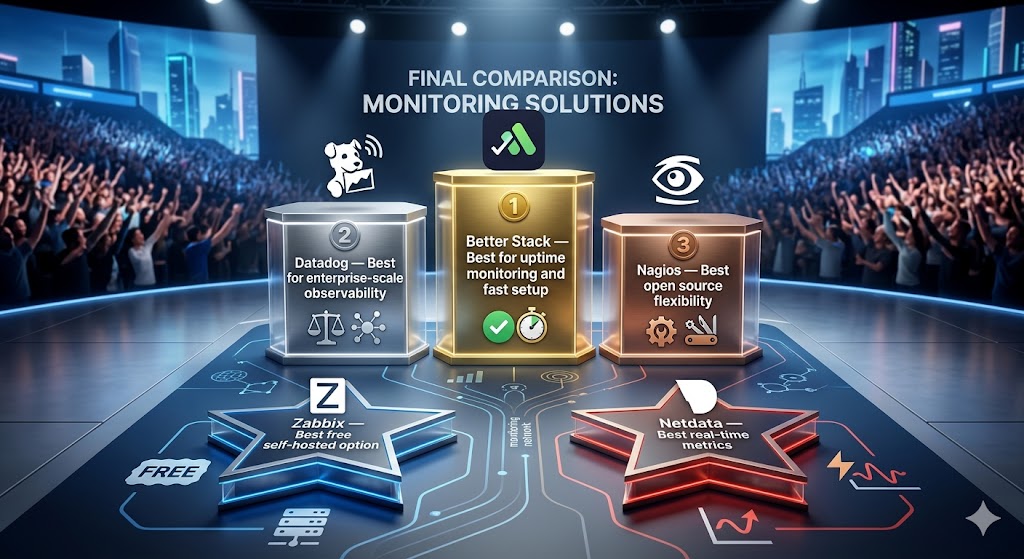
Final Verdict
The right monitoring tool depends entirely on your environment and budget. Here’s the quick summary:
- 🥇 Better Stack — Best for uptime monitoring and fast setup
- 🥈 Datadog — Best for enterprise-scale observability
- 🥉 Nagios — Best open source flexibility
- ⭐ Zabbix — Best free self-hosted option
- ⚡ Netdata — Best real-time metrics
Whatever you choose — stop flying blind. One missed alert at 2am costs more than any of these tools.